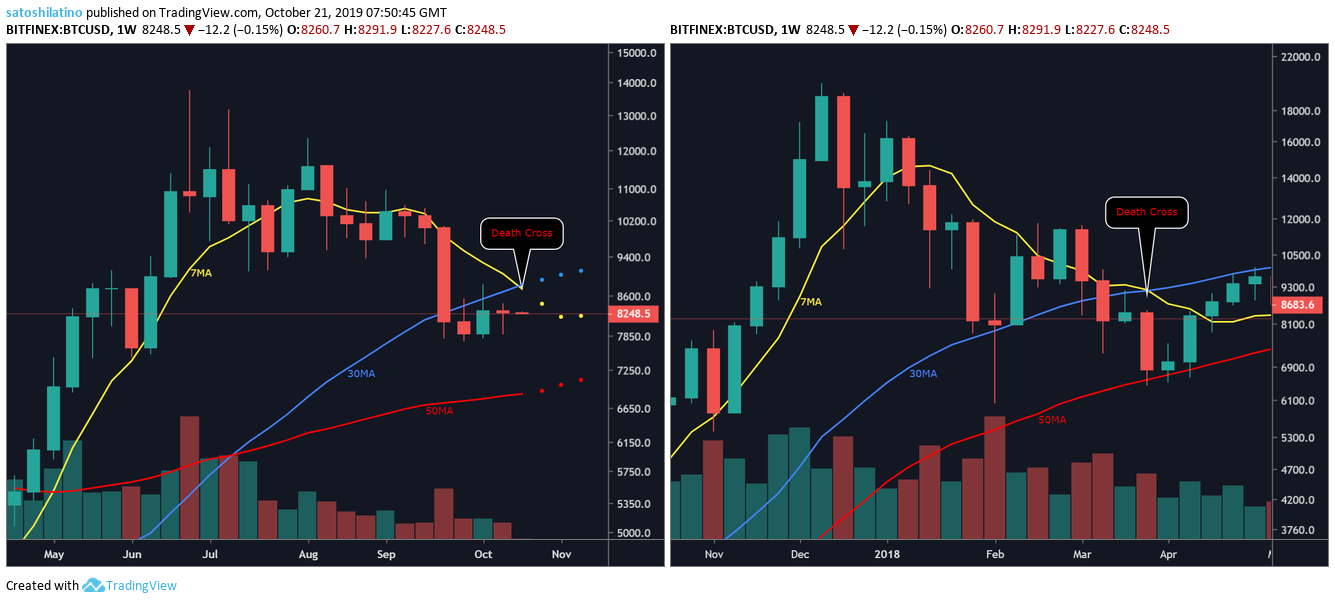
The following technical analysis will evaluate two different price points that must be broken in order for Bitcoin to turn bearish or bullish. Bitcoin technical analysis For the past, month Bitcoin has been consolidating between $7,800 and $8,600. Every time it reaches the support level it bounces off to the resistance level. But, when it hits the resistance level, it falls back to the support level. Now, a technical pattern is signaling a correction that could take this cryptocurrency to $7,000. The 7-week moving average is currently crossing below the 30-week moving average on BTC’s 1-week chart. This is a bearish crossover that is defined as a death cross in technical analysis and usually estimates that a major selloff is underway. The last time this bearish pattern occurred on Bitcoin’s 1-week chart was in late-March 2018. The cross was followed by a 24 percent retracement that took this cryptocurrency from a high of $8,500 to a low of $6,400. Despite the downturn, BTC was able to find support around the 50-week moving average which served as a rebound point at the time. If the recent death cross is able to trigger a spike in sell orders, then Bitcoin could soon plummet over 15 percent from current price levels. This will allow BTC to test the 50-week moving average that sits around $7,000.
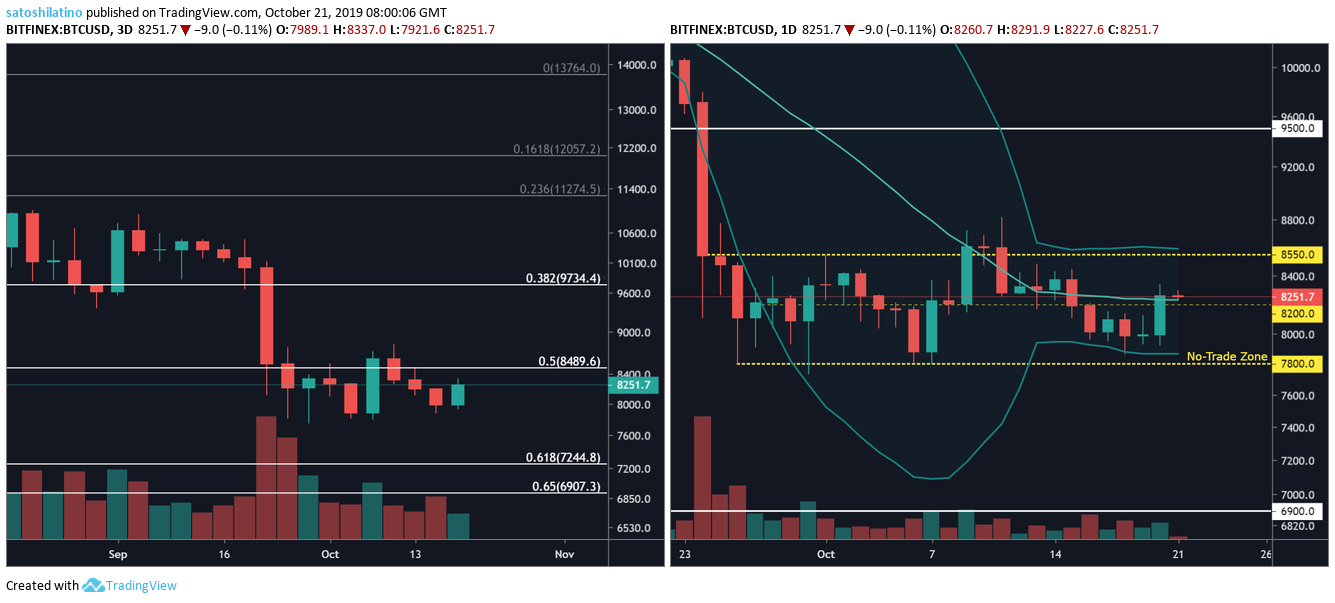
Based on its 3-day chart, a move down to $7,000 would take Bitcoin to hit the 61.8 and 65 percent Fibonacci retracement level. This is considered by many traders as the “golden” retracement level due to the high probability of a rebound. Therefore, if the pullback takes place Bitcoin could bounce off the 50-week moving average as it did in March 2018 and possibly resume its bullish trend. Bitcoin’s price action on its 1-day chart could be used to confirm or invalidate the bearish scenario. Under this timeframe, the Bollinger bands are squeezing. Squeezes are indicative of periods of low volatility and are typically succeeded by periods of high volatility. The longer the squeeze the higher the probability of a strong breakout that defines the direction of the trend. As a result, the area between the lower and the upper Bollinger band can be considered a no-trade zone. This area is defined by the $7,800 support and the $8,600 resistance level. Breaking to the downside of this trading range could trigger a steep decline to around $7,000. However, an increase in volume that takes Bitcoin to break above $8,600 could have the necessary buying pressure to take this cryptocurrency to $9,500 or even $10,000.
Bitcoin recently experienced a death cross on its 1-week chart that has the potential to ignite a retracement to around $7,000. Even though this bearish formation is estimating a downturn, the lower time frames tell that it will all depend if BTC is able to move below $7,800. Until that happens, this cryptocurrency could continue consolidating within a no-trade zone that can be better seen on its 1-day chart. Bitcoin could invalidate this bearish scenario if it breaks above $8,600, which could signal an upswing to $9,500. Bitcoin, currently ranked #1 by market cap, is up 1.52% over the past 24 hours. BTC has a market cap of $147.58B with a 24 hour volume of $16.74B. Chart by CryptoCompare Bitcoin is up 1.52% over the past 24 hours. Posted In: Bitcoin, 价格 Watch, Technical Analysis —- 编译者/作者:不详 玩币族申明:玩币族作为开放的资讯翻译/分享平台,所提供的所有资讯仅代表作者个人观点,与玩币族平台立场无关,且不构成任何投资理财建议。文章版权归原作者所有。 |
Bitcoin is signaling a downturn, but there is hope for an upswing
2019-10-22 不详 来源:区块链网络
LOADING...
相关阅读:
- 比特币创年内新高这次的至高点在多少?2020-10-27
- 比特币价格暴跌超过美国众议院反对派3%以上。 反对注钱措施2020-10-27
- 币圈王哥:10月27日早间比特币行情分析及操作策略2020-10-27
- 青禾谈币——10-27早间以太行情分析策略2020-10-27
- RioChain技术发展简讯|2020.10.242020-10-27

 BTC/USD by TradingView
 BTC/USD by TradingViewOverall sentiment